RTG #2: Titanic

In this article, we’ll take a look at what is probably the most well-known competition on Kaggle: Titanic - Machine Learning from Disaster
The problem
The task here is pretty simple: Given some information about a passenger on the Titanic, predict if the passenger will survive or not. The data given is already split into train and test sets, and to make a submission, the competitors must send a CSV file containing the labels predicted for the test set.
The data
Apart from information regarding the family members of each passenger (which was recorded in one of the weirdest ways possible), everything else was pretty standard. The data included some specific information about a person (age, sex, etc.) and their trip (port of embarkation, ticket class, passenger fare, etc.).
| PassengerId | Survived | Pclass | Name | Sex | Age | SibSp | Parch | Ticket | Fare | Cabin | Embarked |
|---|---|---|---|---|---|---|---|---|---|---|---|
| 1 | 0 | 3 | Braund, Mr. Owen Harris | male | 22 | 1 | 0 | A/5 21171 | 7.25 | S | |
| 2 | 1 | 1 | Cumings, Mrs. John Bradley (Florence Briggs Thayer) | female | 38 | 1 | 0 | PC 17599 | 71.2833 | C85 | C |
| 3 | 1 | 3 | Heikkinen, Miss. Laina | female | 26 | 0 | 0 | STON/O2. 3101282 | 7.925 | S | |
| 4 | 1 | 1 | Futrelle, Mrs. Jacques Heath (Lily May Peel) | female | 35 | 1 | 0 | 113803 | 53.1 | C123 | S |
| 5 | 0 | 3 | Allen, Mr. William Henry | male | 35 | 0 | 0 | 373450 | 8.05 | S | |
| 6 | 0 | 3 | Moran, Mr. James | male | 0 | 0 | 330877 | 8.4583 | Q | ||
| 7 | 0 | 1 | McCarthy, Mr. Timothy J | male | 54 | 0 | 0 | 17463 | 51.8625 | E46 | S |
| 8 | 0 | 3 | Palsson, Master. Gosta Leonard | male | 2 | 3 | 1 | 349909 | 21.075 | S | |
| 9 | 1 | 3 | Johnson, Mrs. Oscar W (Elisabeth Vilhelmina Berg) | female | 27 | 0 | 2 | 347742 | 11.1333 | S |
The family information was encoded in two variables: SibSp and ParCh, whose names clearly indicate what they measure, but I’ll explain just in case. sibsp stands for the number of Siblings and Spouses a passenger had on board, and parch stands for the number of Parents and Children a passenger had on board.
The training set had a total of 891 records, and the test set had 418. Most of the data cleaning wasn’t all that challenging: just removing some columns that yielded no useful information (all distinct values) or were too irregular to make sense of.
The imputation of missing values, however, was quite interesting. Usually, I would just drop rows with missing values, or impute something like the mean of a feature. This time I checked some notebooks beforehand and found this one, in which the author applied a more nuanced strategy.
He first searched among available data for columns that had a significant influence on the distribution of the column he wanted to impute. Then he grouped the data by influential_col and used statistics from each of the groups to impute col_with_missing_values. I applied a similar (exactly the same) strategy in my imputation process.
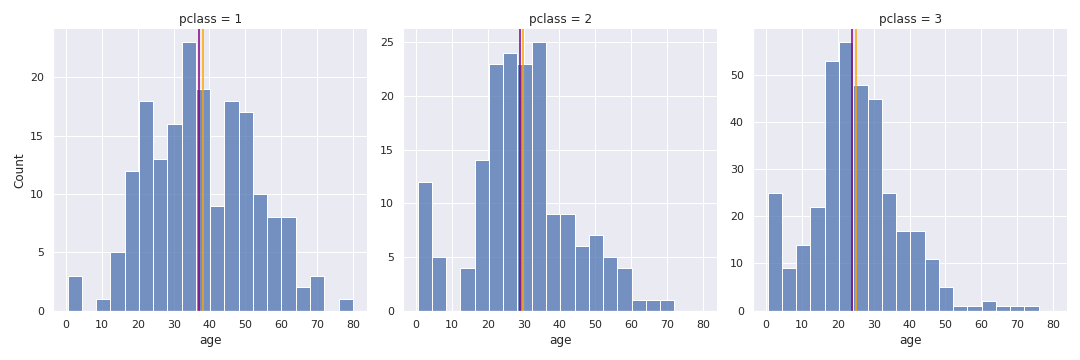
 The Age distribution is different depending on the value of
 pclass. To impute missing Age values, we check the data point’s pclass and use the median age (purple) for that pclass
The last thing worth noticing was a little bit of feature engineering. After analysis I noticed some differences in the distribution of people who had missing age information and those who didn’t, so I decided to add a new feature to tag people whose age got imputed.
The solution
The problem is a binary classification one, and the algorithms I chose to tackle it were logistic regression, random forest, and AdaBoost. Nothing fancy. One cool thing about this lineup is that none of those require standardization of the input data: logistic regression doesn’t need it, and the trees used in random forest and AdaBoost don’t care about the scale of the features.
It was only a matter of selecting the best performer among those. Scikit-learn’s GridSearchCV was the tool for the job, as it allowed me to try all the classifiers on the same input data, each with a different set of hyperparameters, all in one go.
The best performer ended up being random forest, perhaps unsurprisingly. In the initial tests it overfit quite a bit, but after tuning some hyperparameters and applying cross-validation (thanks to GridSearchCV) the train accuracy was about 83% and the final submission scored of 77.272%.